TIME SERIES APPROACH
Imagine effortlessly searching for differences within your data. With the time series approach integrated into our BI solutions, you can pinpoint discrepancies quickly and accurately. Whether you're comparing sales figures, customer behavior, or operational metrics, our tools streamline the process, enabling you to make informed decisions with ease.


Furthermore, conducting multi-year analysis becomes a breeze. Gone are the days of laborious manual data manipulation. Our BI platform equipped with the time series approach empowers you to effortlessly analyze data spanning multiple years. Gain deep insights into long-term trends, identify patterns, and make strategic decisions backed by comprehensive historical data analysis.
Comparing different datasets is another area where our BI solutions shine. Whether you're assessing performance across different regions, product lines, or departments, our tools provide the functionality you need to conduct thorough comparative analyses. Quickly identify similarities, differences, and trends across datasets, allowing you to optimize processes and maximize efficiency.
enjoy data analysis moments
free style
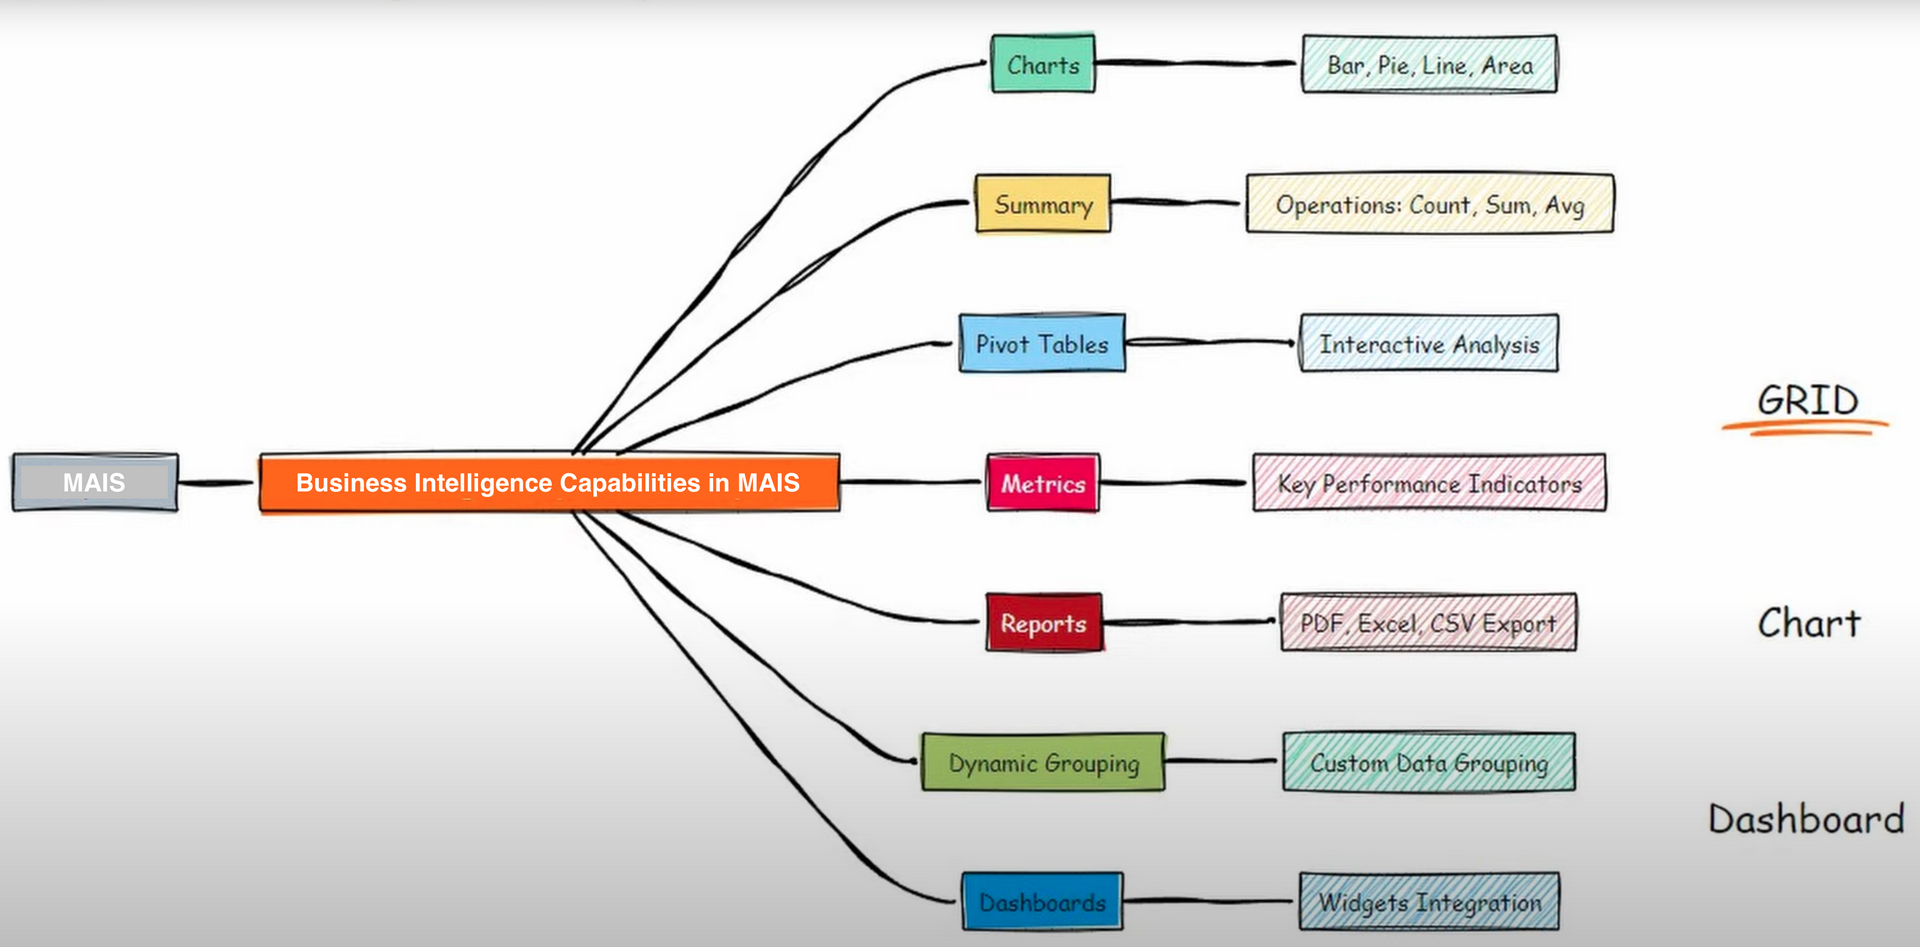
It's important to note that our MAIS business intelligence is not designed to replace popular dashboard solutions such as Power BI or Excel. Instead, it complements these tools, offering unique features and capabilities tailored to meet the needs of modern businesses. While Power BI and Excel excel in data visualization and reporting, our BI platform focuses on providing advanced analytical tools for interactive data analysis.

